Operations dashboard generator — visualize KPIs instantly

What does the operations dashboard generator do for you?
The operations dashboard generator brings your most important KPIs together into a single, easy-to-read dashboard. No more digging through spreadsheets or compiling endless reports — simply connect your data and get a real-time view of your business performance. Spot trends, monitor key metrics, and make quicker decisions, hands-free.
How can you spot business issues before they escalate?
This template tracks your selected KPIs and shows changes as they happen. When a metric moves above or below your targets, you'll know right away — so you can address issues before they turn into bigger headaches. The dashboard keeps your team aligned and ensures nothing slips through the cracks.
How quickly can you refresh your dashboard data?
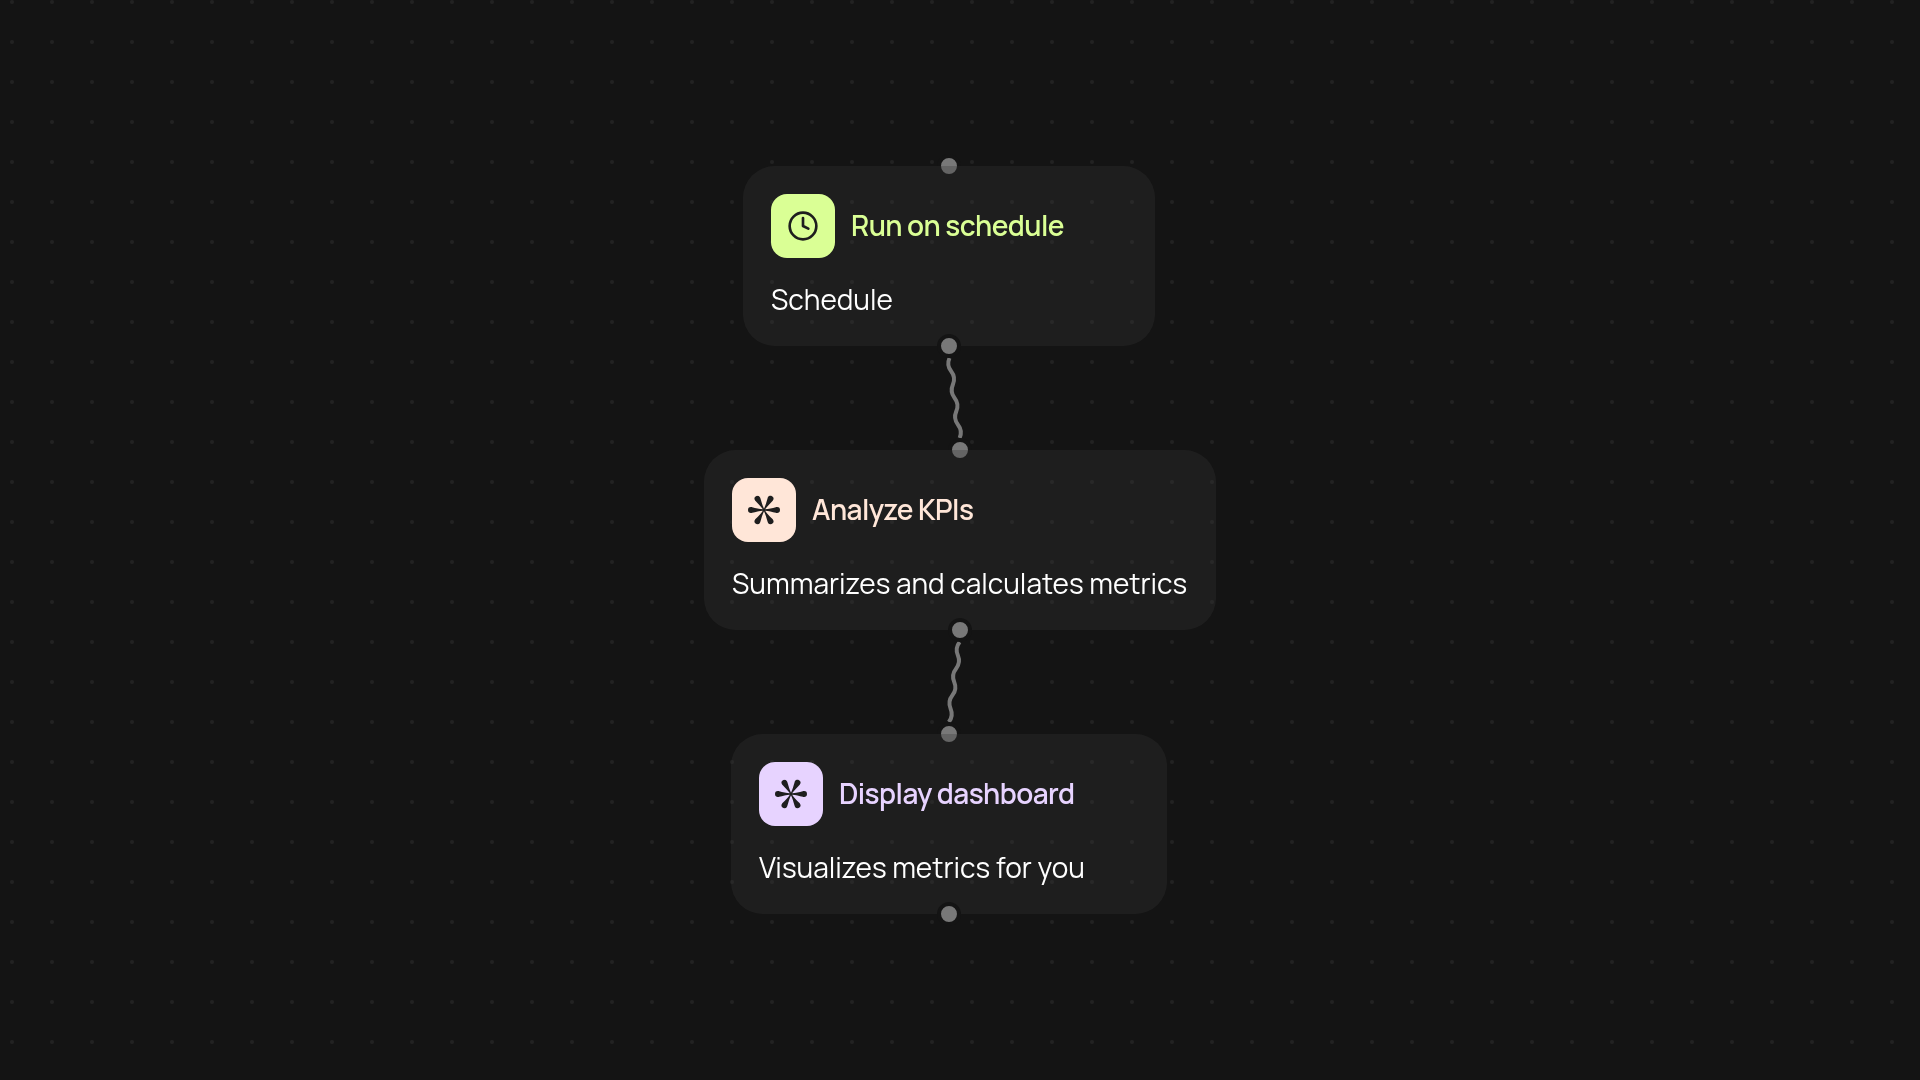
Your KPIs update in the background at the schedule you set. Forget about manual data pulls or late-night reporting scrambles. Your dashboard reflects the latest numbers, all without lifting a finger.
How do you set up your own operations dashboard?
Getting started is simple. Just select your data sources and KPIs, pick a schedule that fits your workflow, and personalize your dashboard view. You’ll only need access to your main business apps or spreadsheets. Once you’re set up, dashboard updates run on autopilot—so you can focus on what matters.
Join the new
way to work.